Six dashboards. Zero exports.
Everything below is generated live from a connected organization — date-range and program filters on every view, and every number clicks through to the rows behind it.
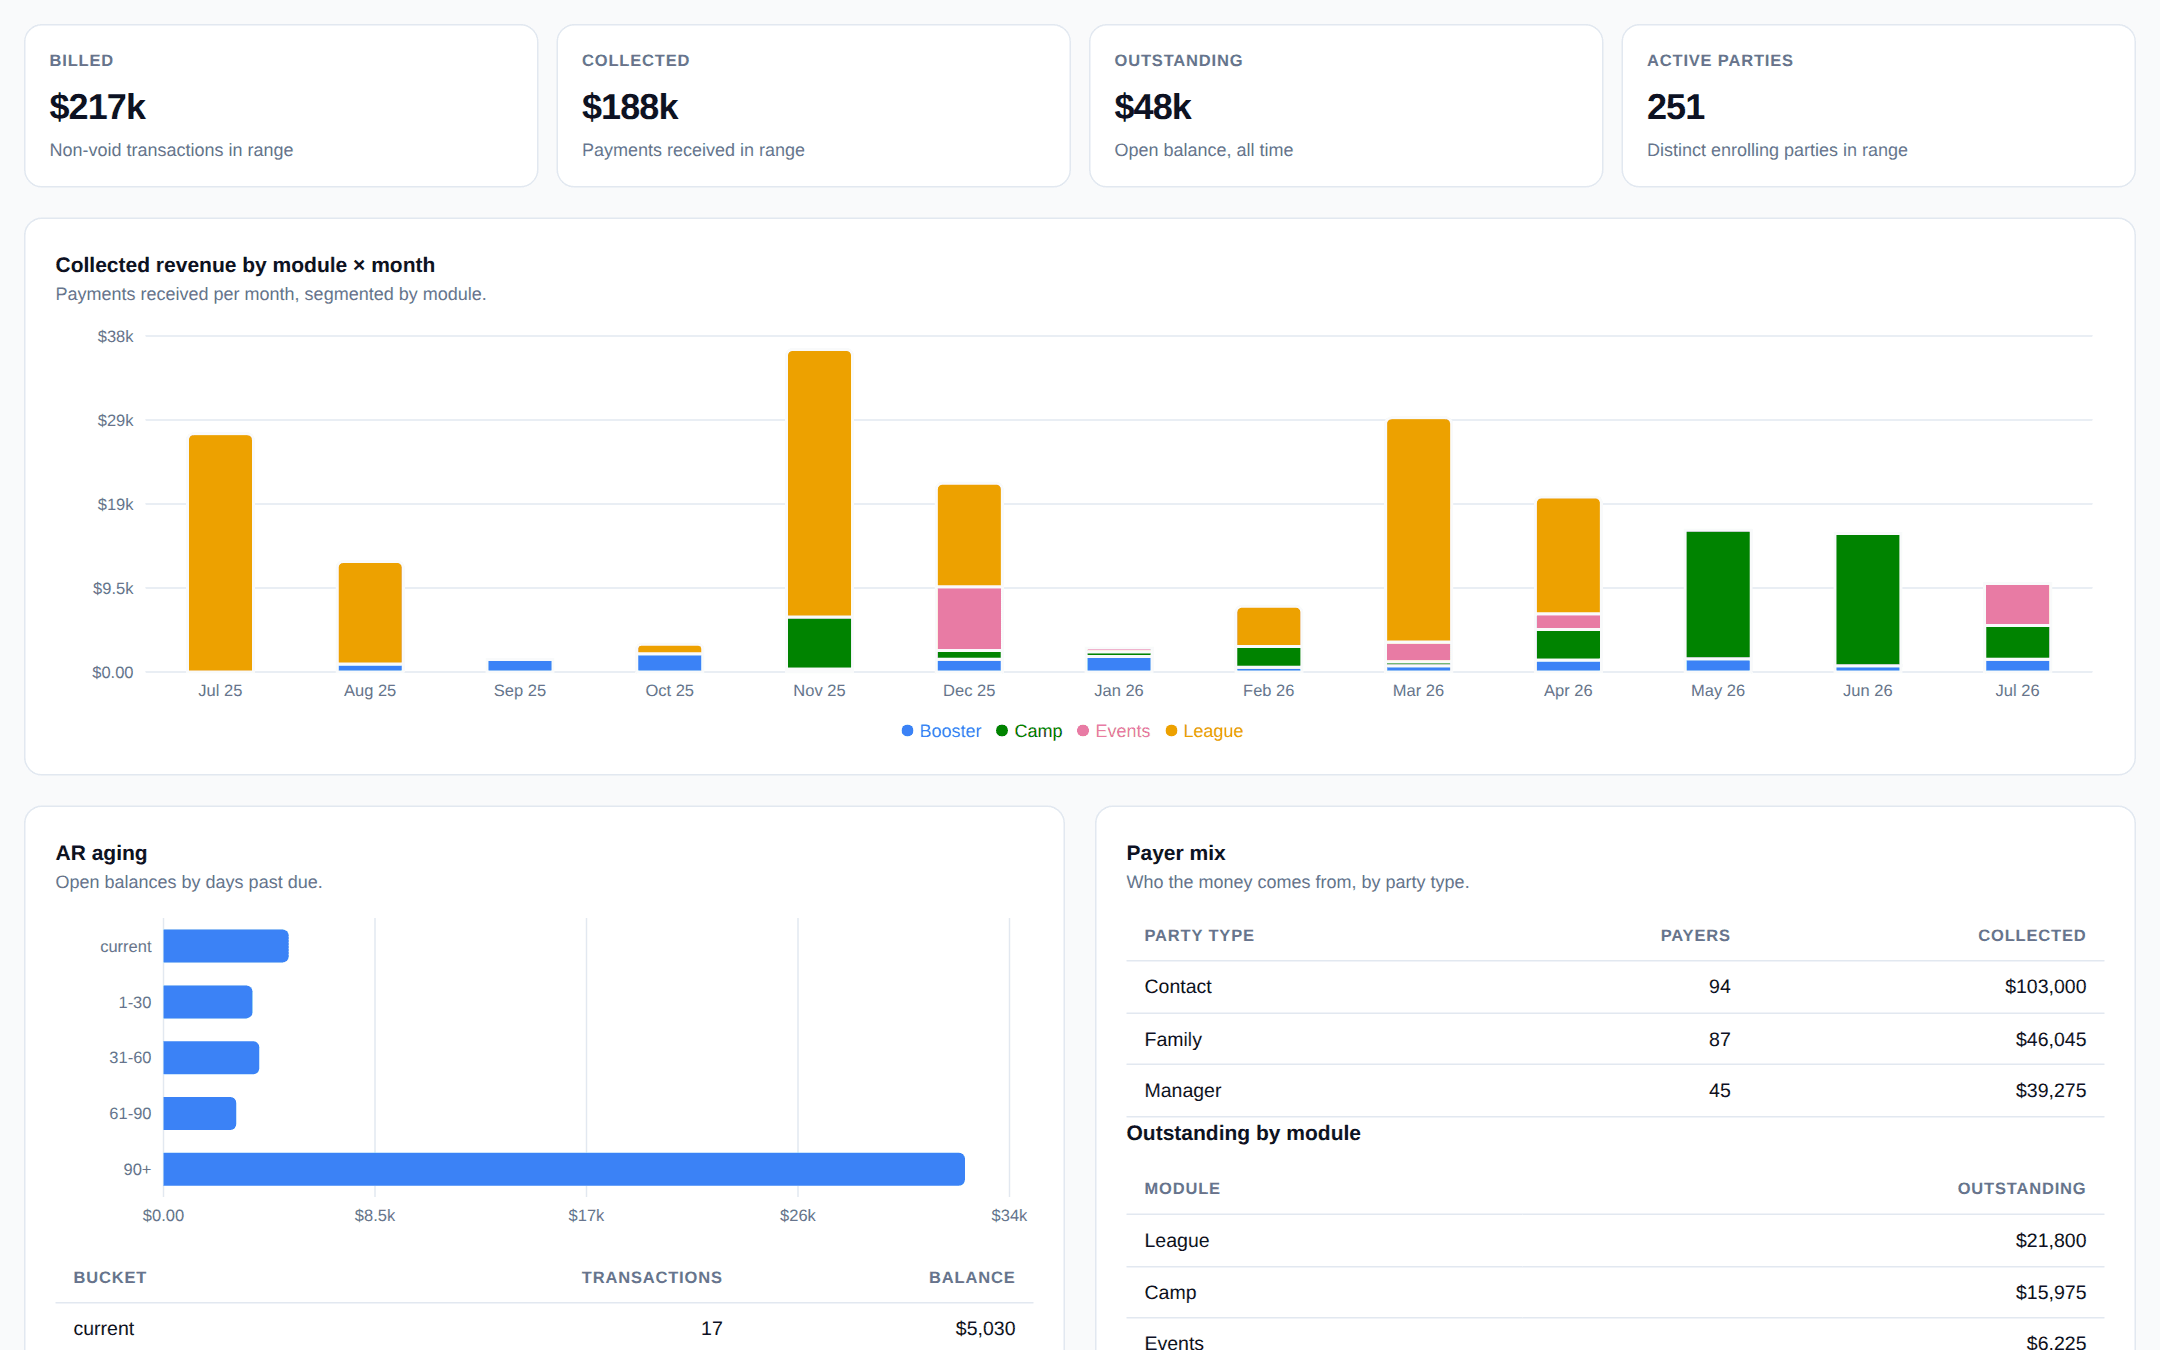
Cross-Module Revenue
Collected and outstanding across every program you run, by month and by module. Payer mix shows who the money actually comes from; AR aging shows exactly what's stuck and how stuck it is.
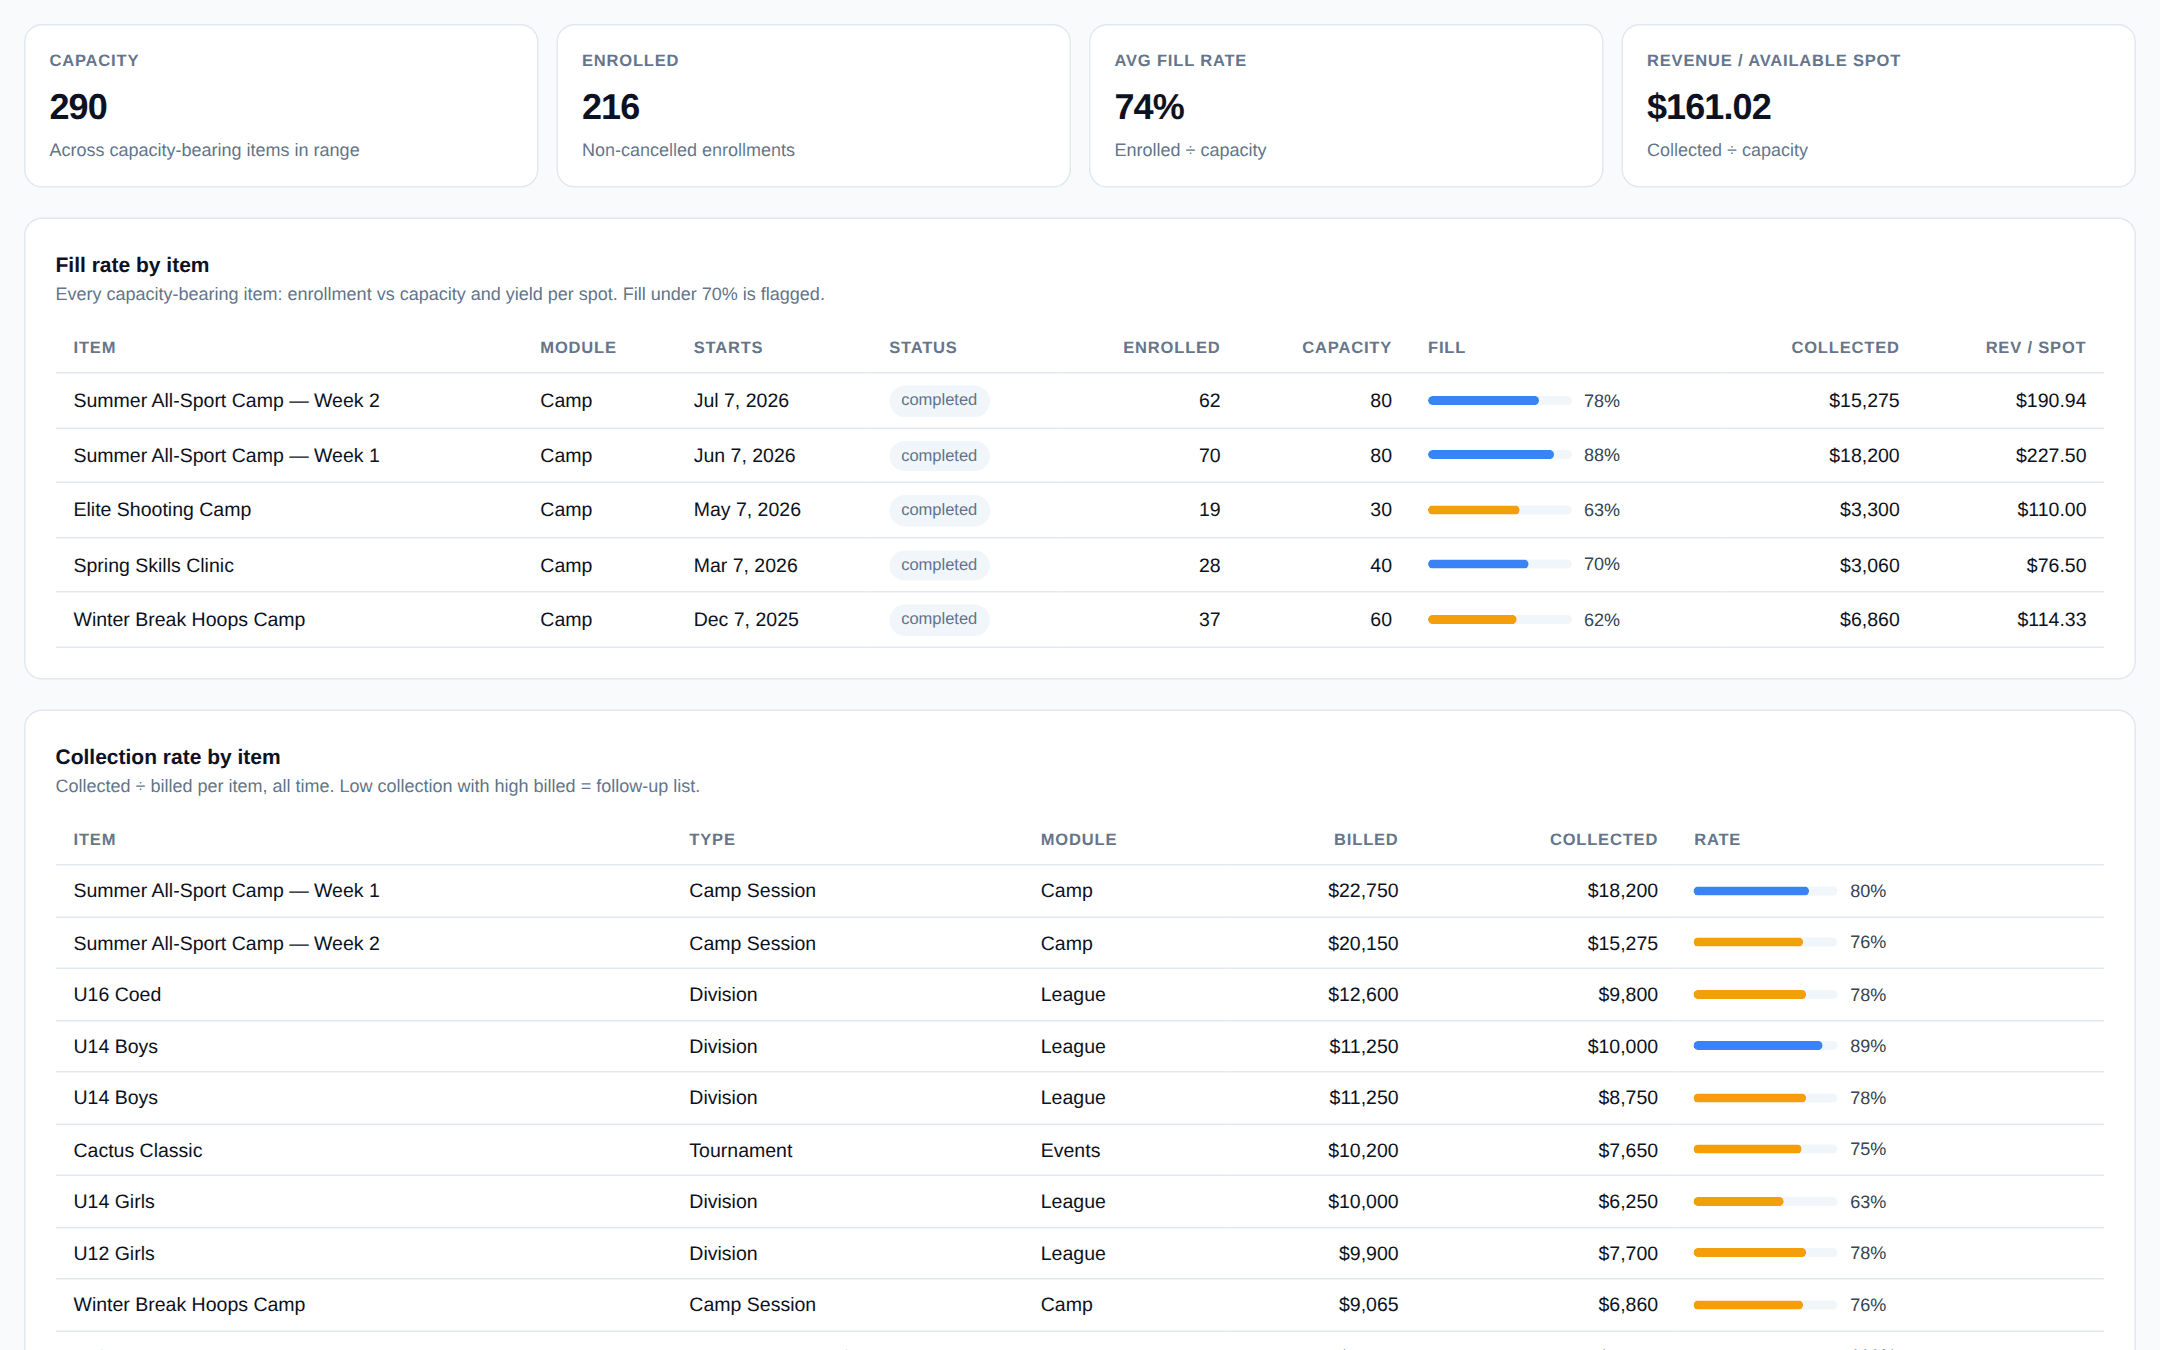
Utilization & Fill Rate
Every capacity-bearing item — sessions, divisions, events — with enrollment against capacity and revenue per available spot. Undersold inventory is flagged before the season starts, not after.
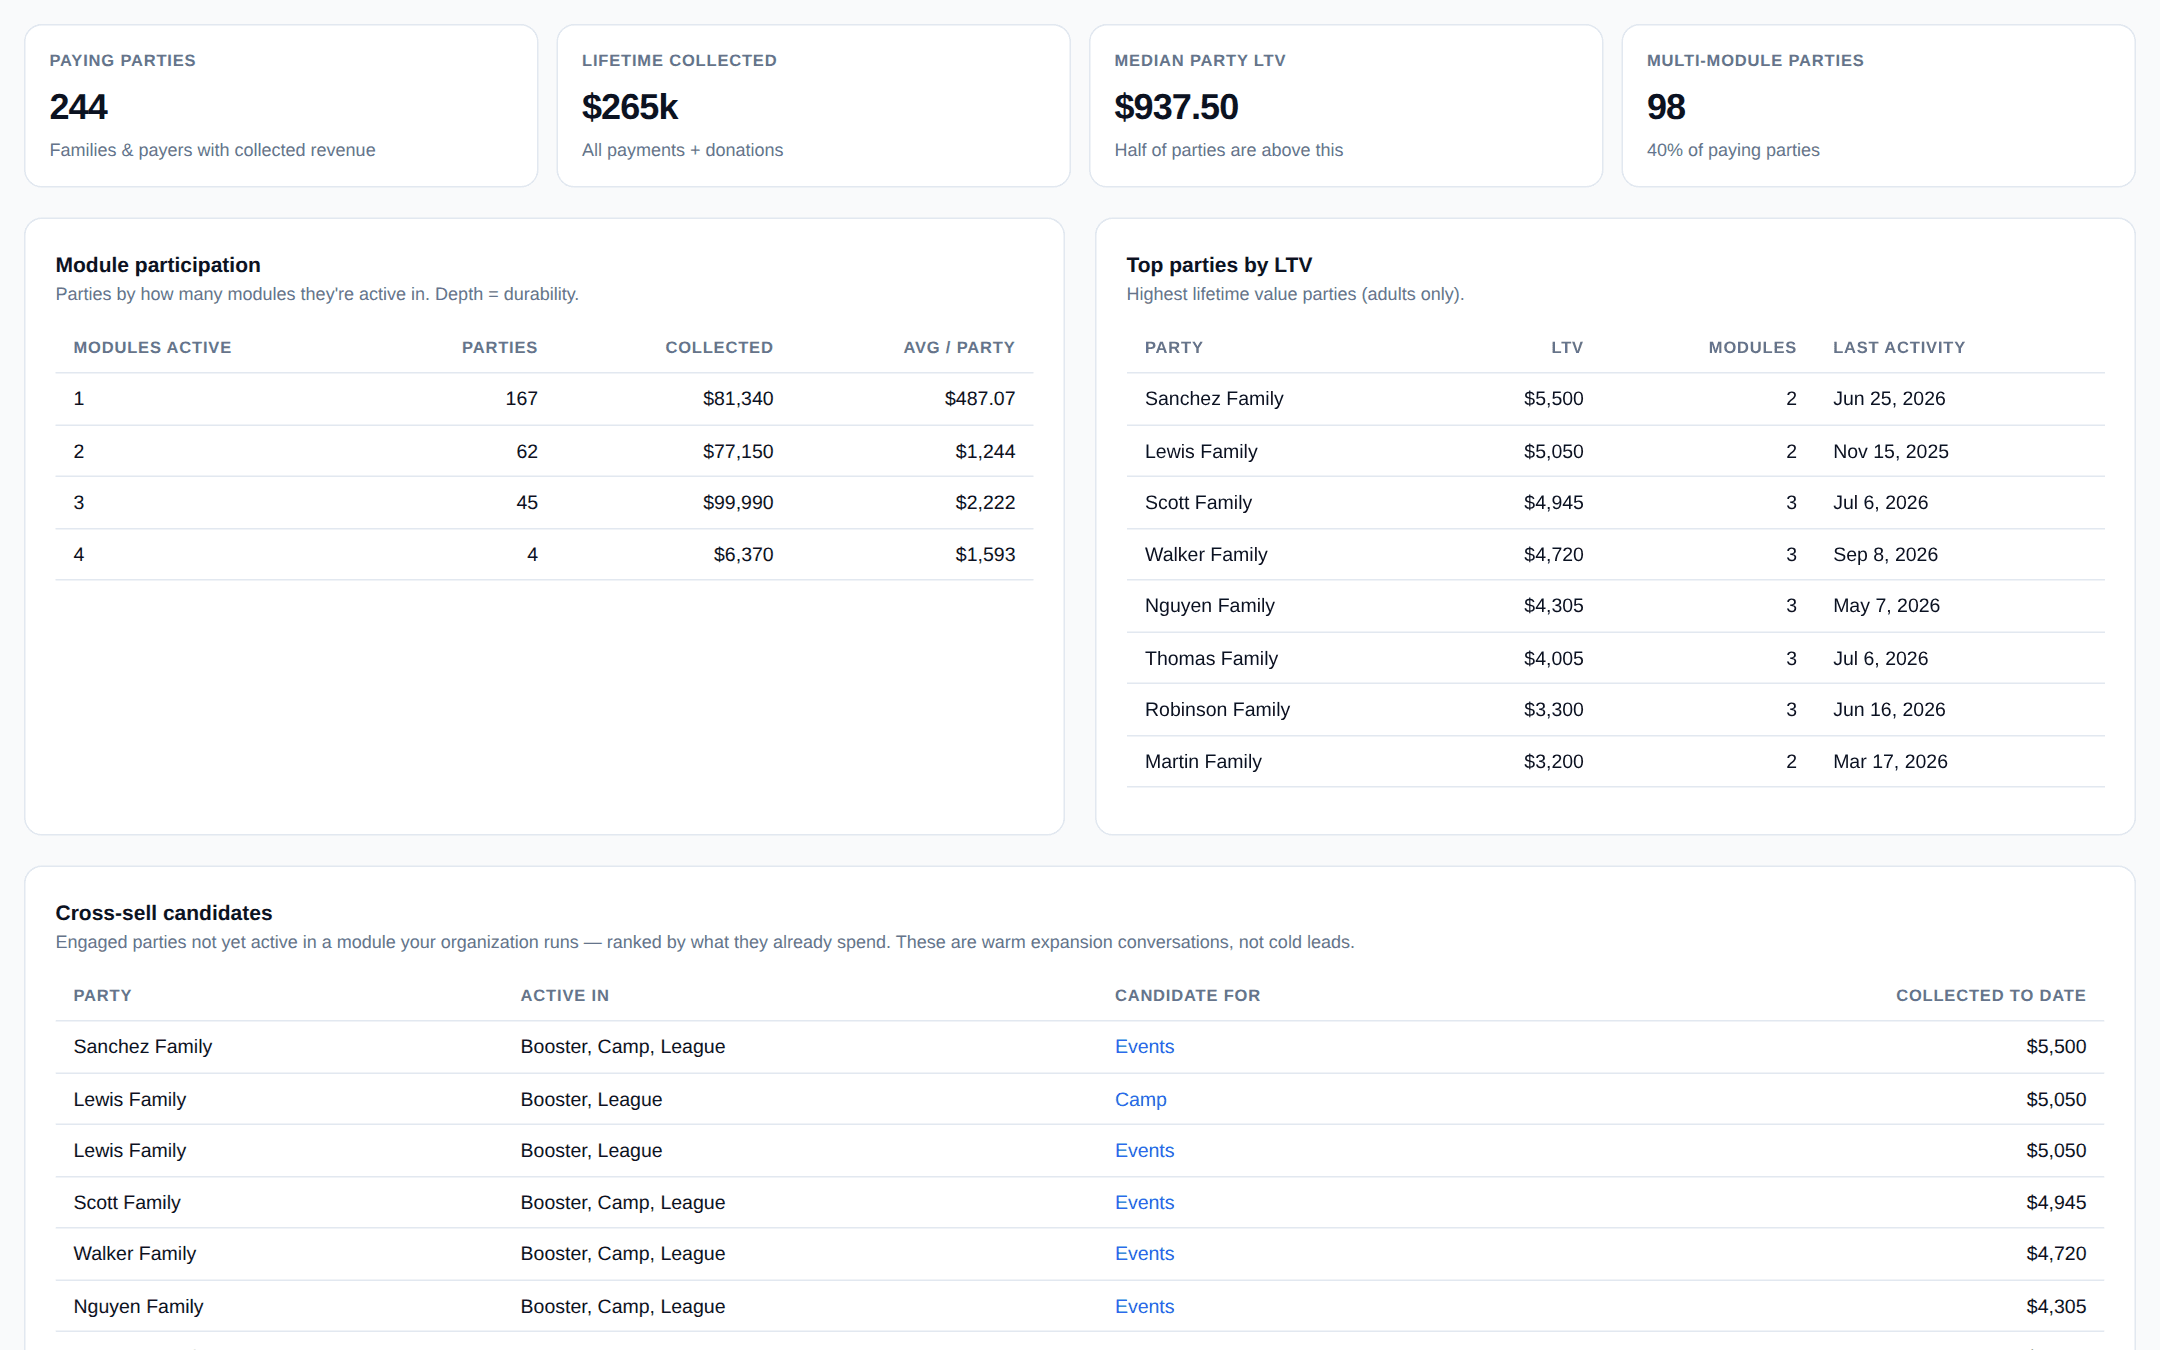
Party LTV & Cross-Sell
Lifetime value at the family level, and a ranked list of engaged families not yet in a program you run. These are warm expansion conversations — adults only, always.
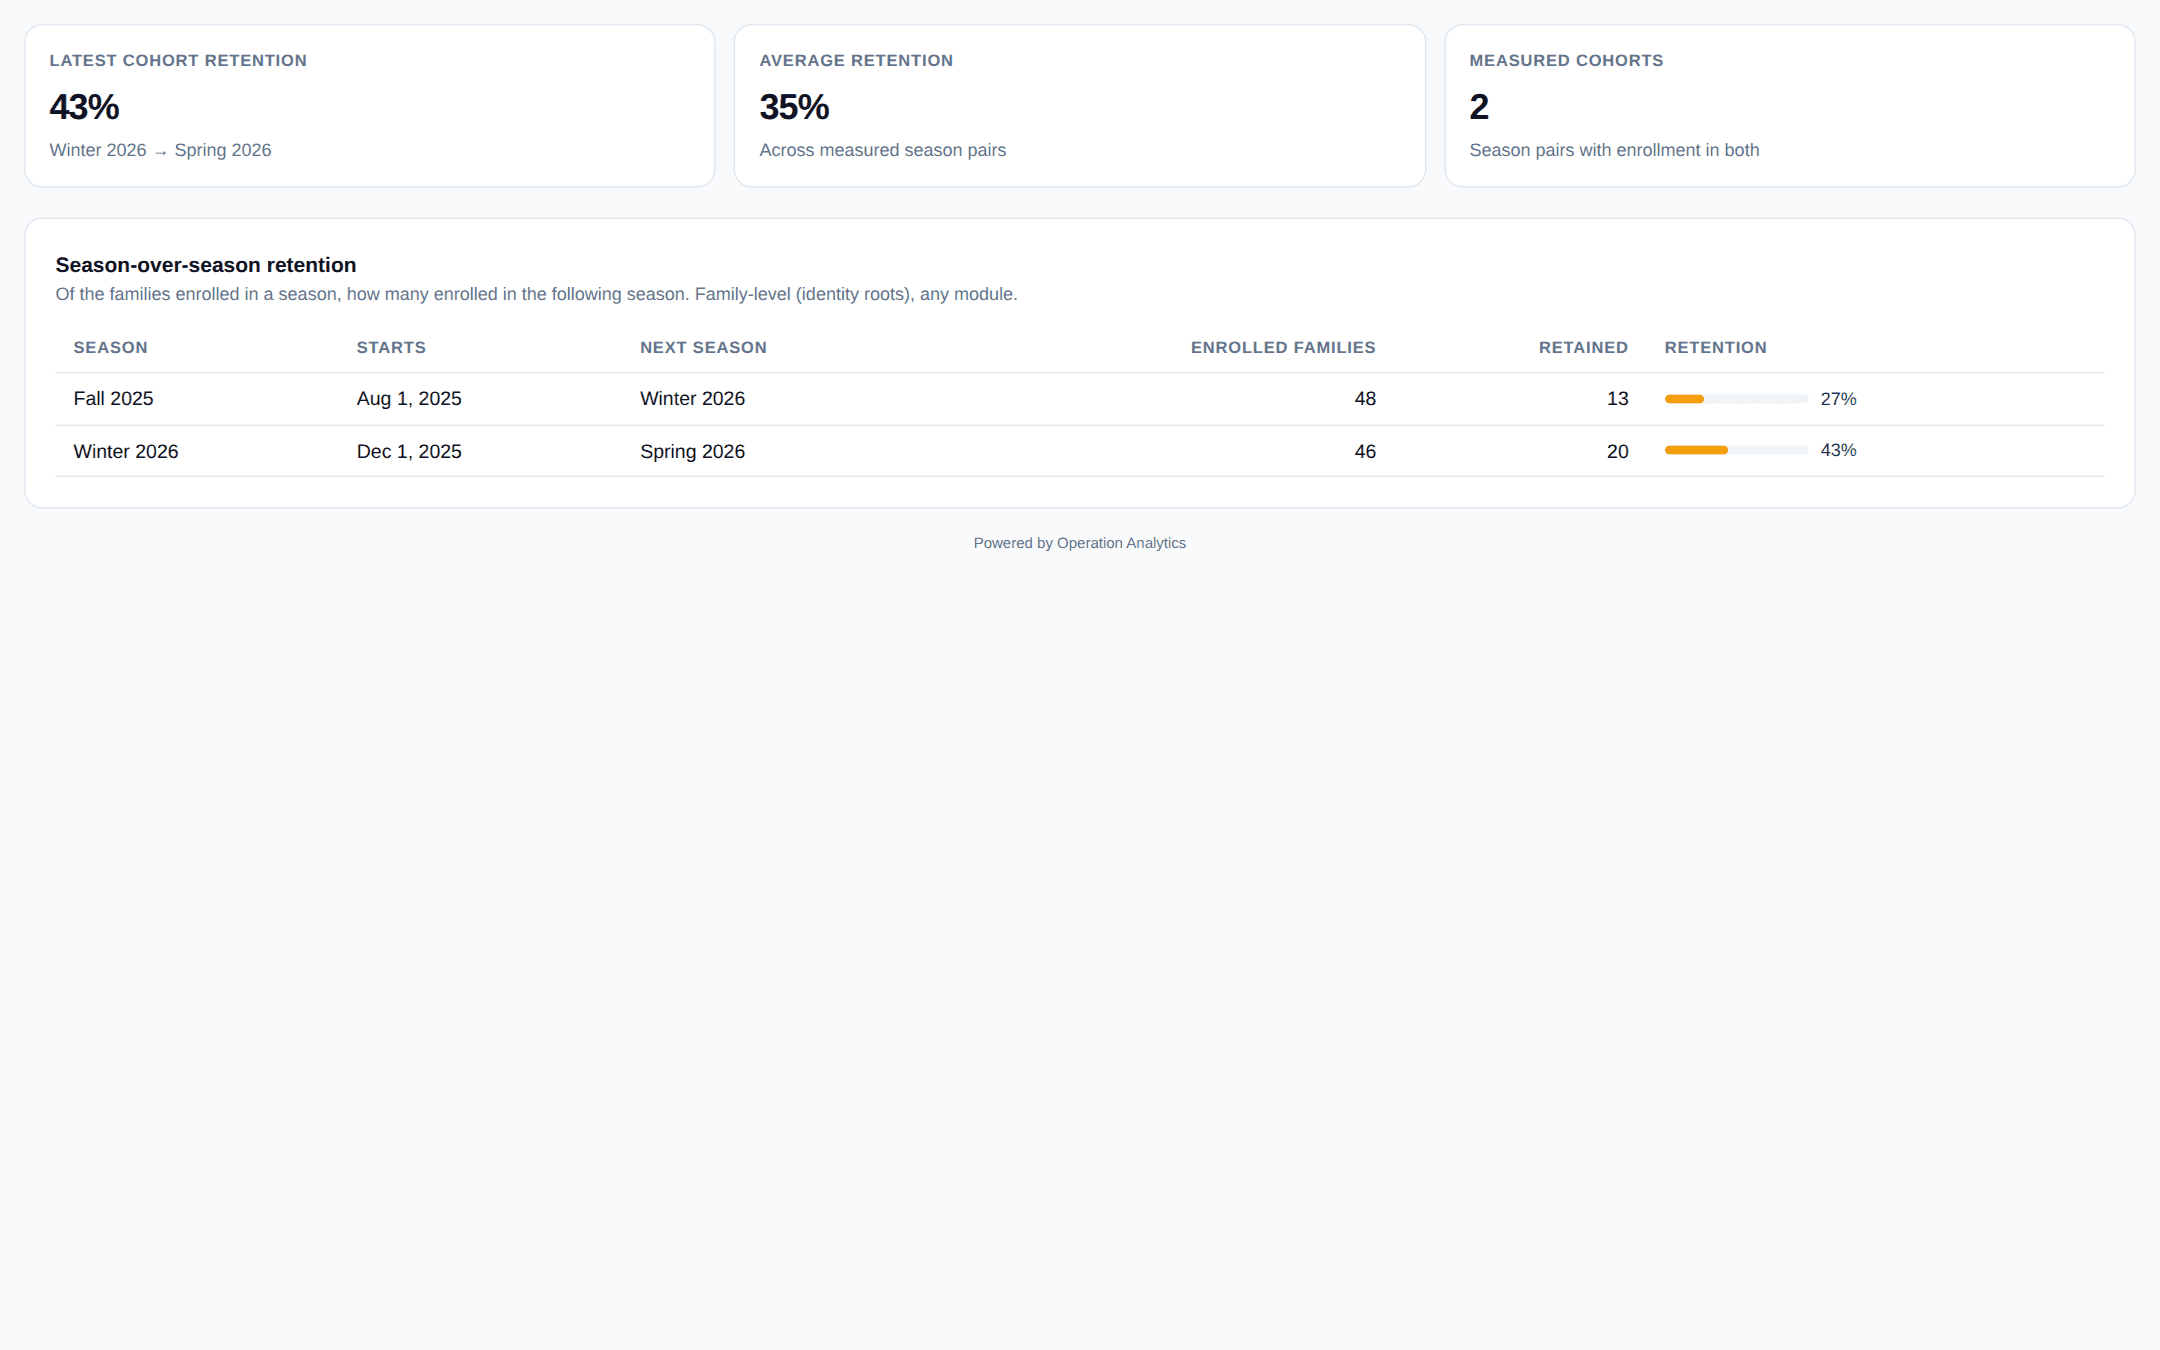
Retention Cohorts
Season-over-season re-enrollment at the family level. The single best leading indicator of next season's revenue, computed continuously instead of guessed at annually.
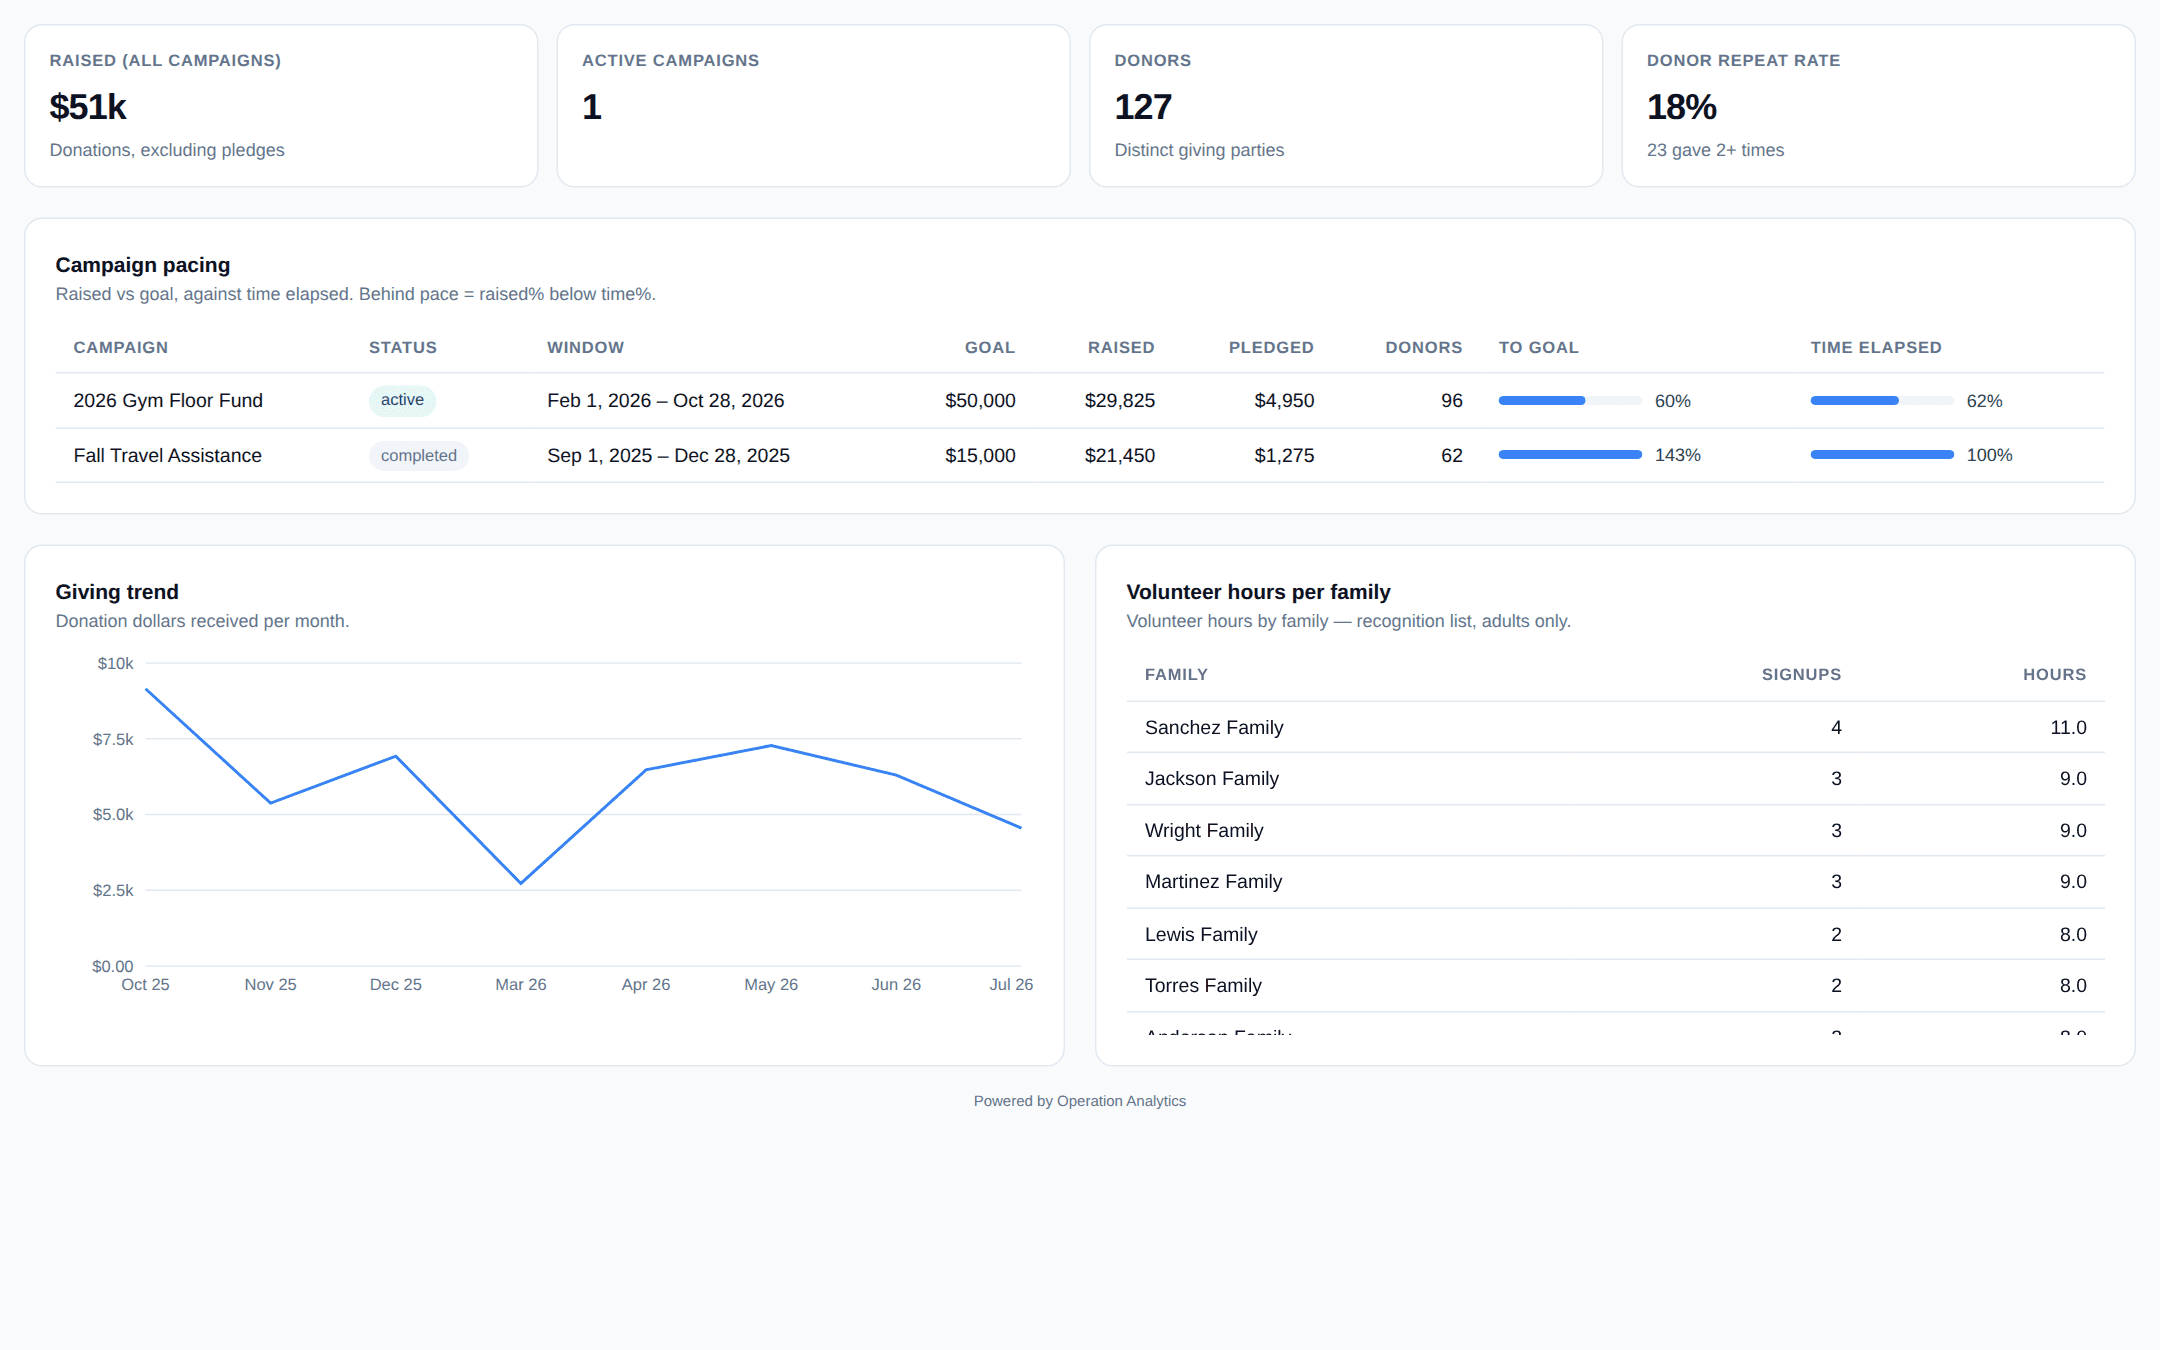
Fundraising & Booster Health
Campaign pacing against goal and against time, donor repeat rate, and volunteer hours by family. Know by week two whether a campaign will land — while there's still time to act.
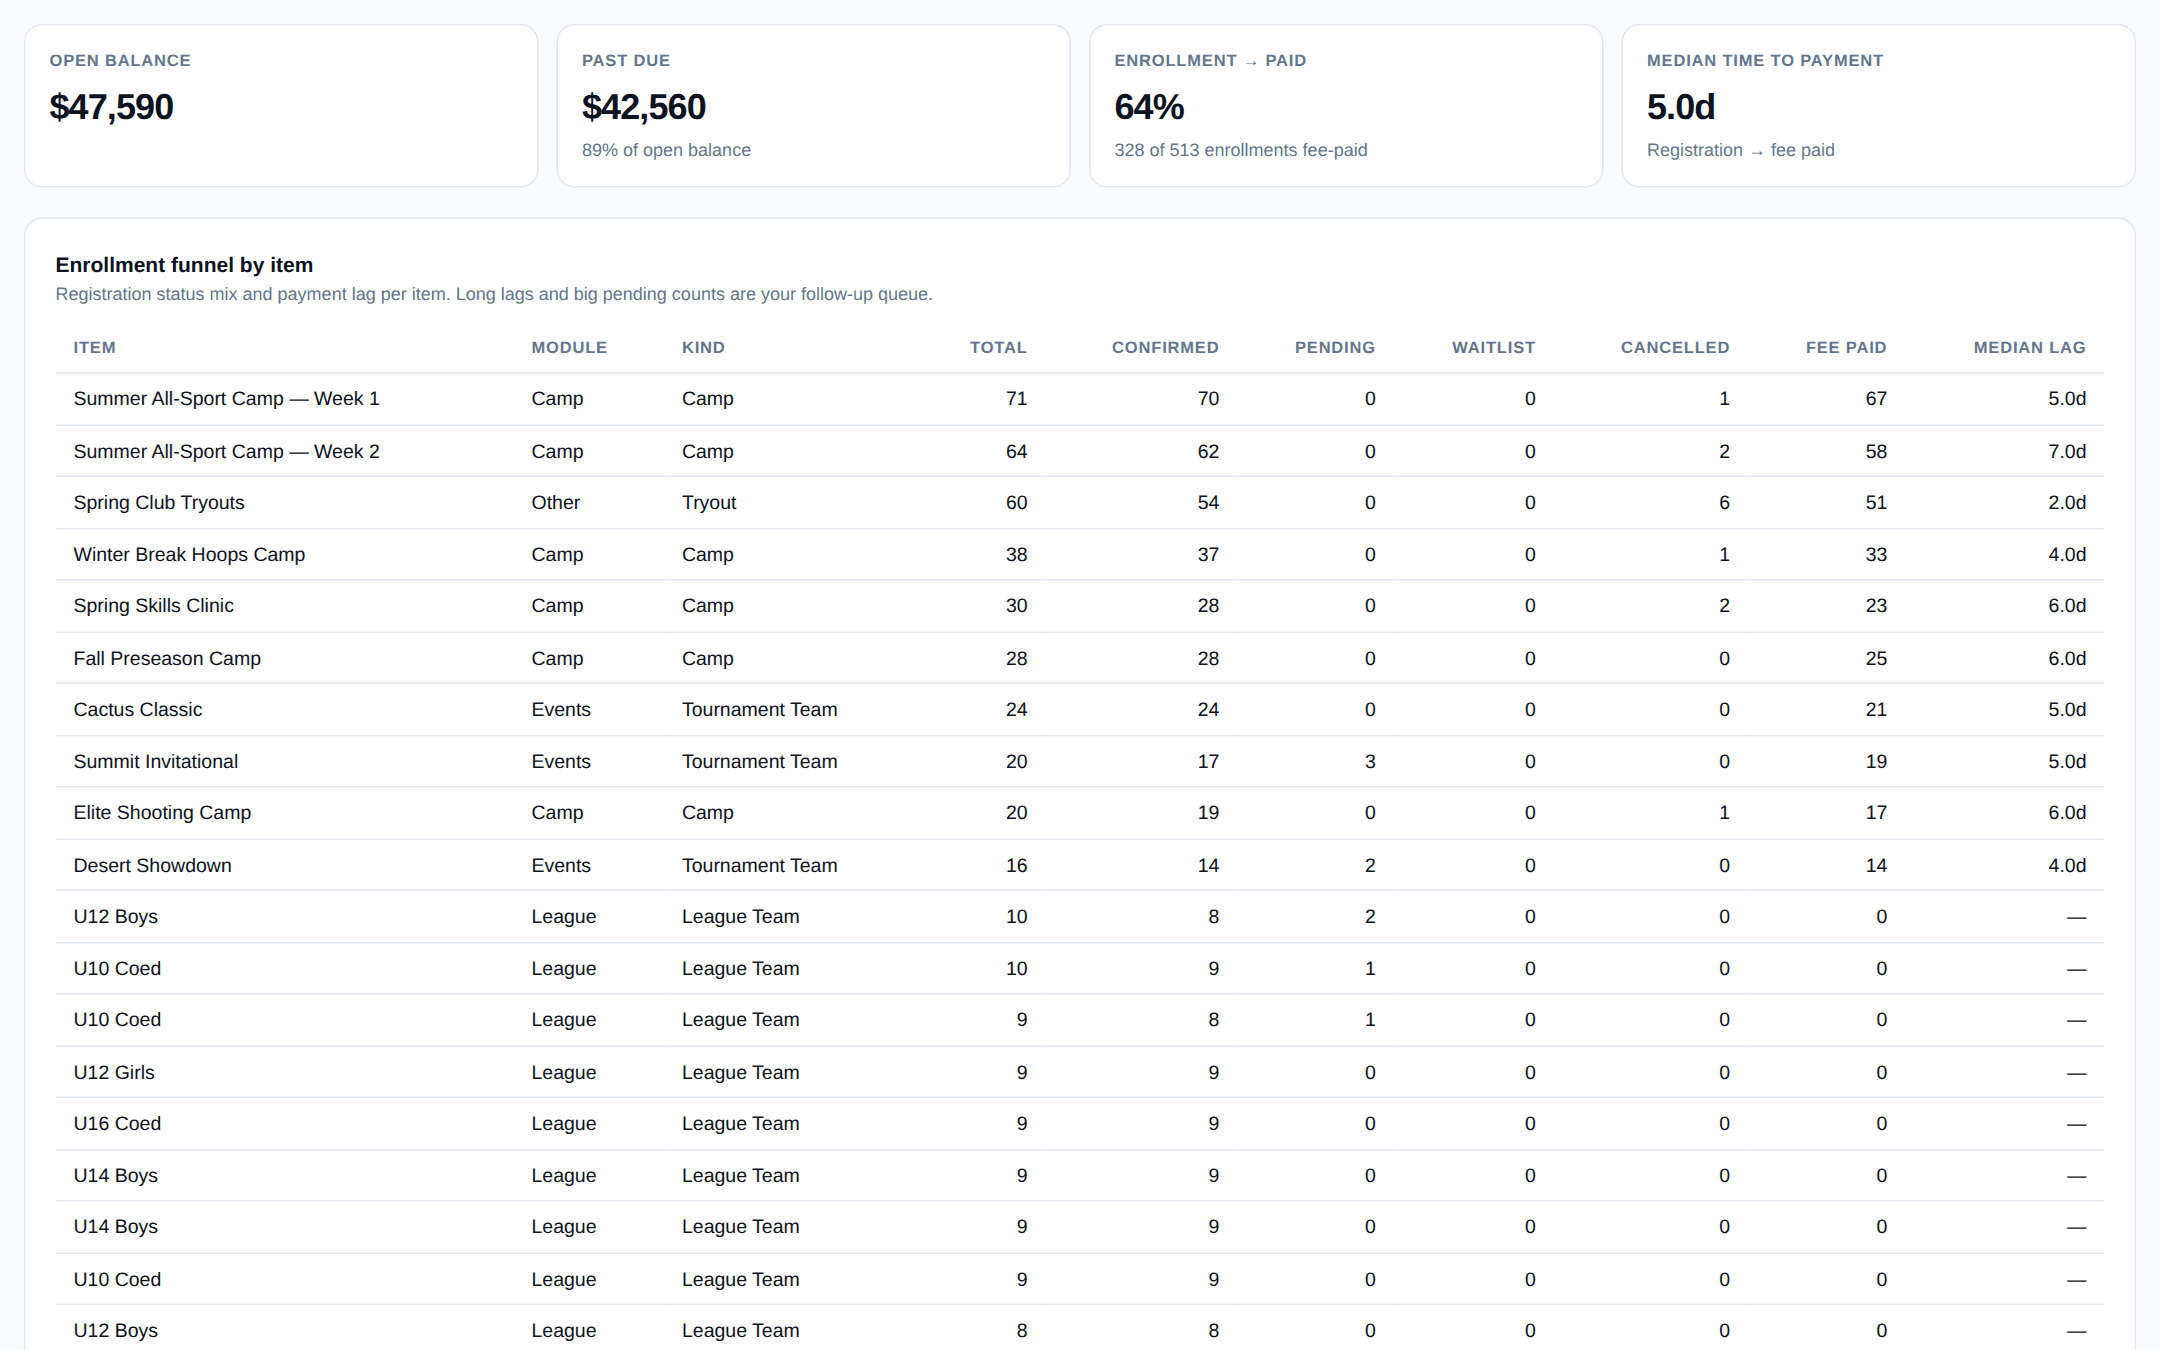
Collections & Funnel Ops
Open balances ranked oldest-first, registration-to-payment lag per item, and the status mix of your enrollment pipeline. This page is the Monday-morning follow-up queue.
Plus a weekly brief that reads itself
Every Monday: what changed, why — traced to your data — and 2–3 recommended actions. Written by AI, grounded entirely in your numbers.
Become a design partner